
At the risk of “phoning it in” this month, I felt this Costar article published on August 24th of this year was necessary to share. We’ve talked at length about why we continue to be bullish on high-quality multifamily assets in strong markets, and the data in the article truly drives that point home. Unfortunately, there are many families and individuals that would love to buy a home and simply are not able to do so. The cyclical forces that drive single-family home prices down to a more affordable level seem to be fundamentally different this time. As you’ll see below in the data, low supply driven by a number of factors, even in the face of rising interest rates, does not appear to be having a substantial cooling effect on prices.
—————————————
Housing Affordability: Going, Going, Gone!
The combination of higher mortgage rates as the Federal Reserve tries to tame inflation and sky-high housing prices continues to cut into housing affordability, driving more prospective buyers out of the market.
The National Association of Realtors provides a measure capturing just how easy—or difficult—it is to buy a house.
Its housing affordability index fell to 98.5 in June, its lowest level in over 33 years, meaning that properties have become even less affordable than they were during the 2006 housing bubble. The group’s index is based on the ratio between the median household income and the necessary income required to qualify for the median-priced house, with larger values indicating greater affordability.
 Of course, the pandemic was a major driver of the recent run-up in housing prices, as urban dwellers fled for the suburbs, and residents of expensive coastal cities found more spacious and affordable places to live inland. It’s no surprise then that affordability varies across the nation. But the pandemic only exacerbated existing affordability patterns. In general, areas rich in amenities and those offering industry-specific career advancement opportunities—such as tech, finance, law, and entertainment hubs—have historically been more expensive, while rural and suburban areas tended to offer greater affordability.
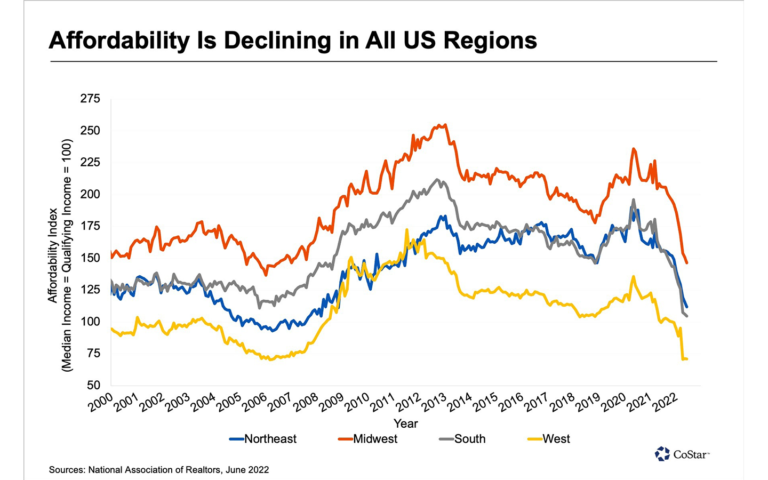
From a regional perspective, housing in the Midwest is the most affordable, but prices there have grown by about 35% since December 2019, based on indices from the Federal Housing Finance Agency. This is a slower rate of increase than in other parts of the U.S. and yet a substantial jump.

The least affordable housing is found in the West. Early in the pandemic, more flexible work-from-home policies helped drive demand to Boise and Salt Lake City from markets with a higher cost of living such as Los Angeles and the Bay Area. Prices in the West’s Mountain region have grown by 55% since December 2019, an astonishing increase that drove affordability levels down and is now leading to a pullback in demand.
Indeed, outsize price gains are shutting many potential buyers out of the market, particularly in the West where existing sales in July were down by 30% over the prior year. In contrast, sales in the more affordable Midwest region declined by just 14.4%. Forward-looking data suggests that sales will continue to decline this month and next, based both on the National Association of Realtor’s pending home sales index and the Mortgage Bankers Association’s index of mortgage applications for purchase.

With sales tumbling, we might expect to see price appreciation cooling, but that might take a while. Inventories remain lean and new stock is being added slowly from rock-bottom levels. Seasonally adjusted inventory began to rise in March, and by the end of July, roughly 1.3 million homes were on the market. But both July and August usually mark the seasonal peak in for-sale inventory as families prefer not to move once the school year begins.
At the same time, labor and material shortages have delayed many housing developments where work was already underway. Typically, one would expect that these could provide additional housing supply to the market in the coming months; housing starts tend to lead completions by about five months in the single-family market. But since early 2021, the lag times have lengthened. Moreover, builders have become far more pessimistic on the housing market as mortgage rates rise and fewer potential buyers visit their models, leading them to hold off on new construction. In July, single-family housing starts fell to an annual rate of 1.1 million units from a recent peak of 1.2 million units in April.

And housing starts will likely pull back even further. The National Association of Home Builders sentiment index, designed to correlate with housing starts six months out, fell to 49 in August from a recent peak of 84 in December. Sentiment has fallen even more in the West, where the index peaked at 91 in March and fell to 42 in August.
—————————————
All these factors are driving more and more people to be renters for longer periods of time.
We will continue to invest well in multifamily assets. It’s a wise and conservative allocation of our capital and yours and allows us to provide a necessary and meaningful service to a growing number of people.